
Investing in commodities has long been a cornerstone of portfolio diversification, offering traders the opportunity to hedge against inflation and benefit from global supply and demand trends. However, the volatile nature of commodity markets requires more than just intuition or a casual glance at price charts.
Successful commodity trading hinges on precise timing and the use of robust analytical tools to guide decisions. Technical analysis, particularly when paired with advanced indicators, allows traders to identify entry points, gauge market momentum, and manage risk with greater confidence.
Understanding Commodity Markets and Price Movements
Commodities, ranging from energy products like crude oil and natural gas to precious metals such as gold and silver, are influenced by a unique set of factors. Supply disruptions, geopolitical tensions, seasonal cycles, and macroeconomic shifts can all lead to sudden price fluctuations. Unlike equities, commodities are often more sensitive to global events, making technical analysis a vital component of a trader’s toolkit.
Price charts provide a visual representation of these movements, but understanding patterns requires more than observing highs and lows. By analysing trends, support and resistance levels, and historical price behaviour, traders can develop strategies that anticipate market reactions. Technical indicators enhance this process by offering quantitative insights into momentum, volatility, and potential reversals.
The Role of Technical Indicators in Timing Entries
One widely used category is momentum indicators. Tools like the Relative Strength Index (RSI) and the Moving Average Convergence Divergence (MACD) help traders assess whether a commodity is overbought or oversold, signalling potential reversals. RSI, for example, evaluates price changes over a specific period to determine the strength of a trend, highlighting periods when the market may be poised for a pullback or breakout. MACD, on the other hand, measures the convergence or divergence between moving averages, offering insight into the strength and direction of price momentum.
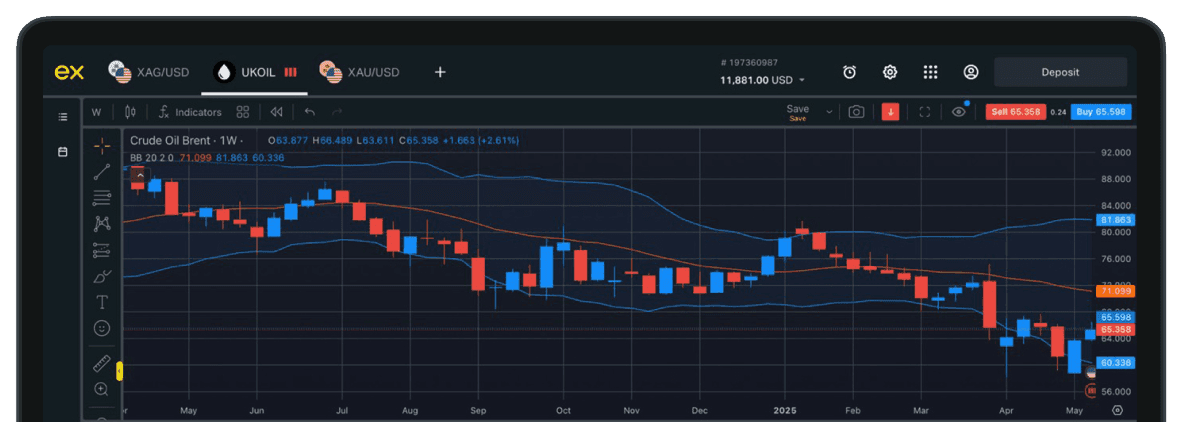
Volatility indicators are another key component in timing entries. The Average True Range (ATR) and Bollinger Bands provide traders with a sense of price fluctuation magnitude and potential breakout zones. ATR measures the average range between high and low prices over a specified period, giving traders a realistic expectation of price swings. Bollinger Bands expand and contract based on volatility, indicating when a commodity may be entering a period of consolidation or heightened price movement.
Volume-based indicators, including On-Balance Volume (OBV) and the Chaikin Money Flow (CMF), reveal the level of market participation behind price movements. These tools help traders confirm trends by showing whether buying or selling pressure is increasing, providing additional validation for entry points.
Combining Indicators for Enhanced Precision
No single indicator can provide a complete picture of market behaviour. Successful traders often combine multiple indicators to generate more reliable signals. For instance, a trader may use RSI to identify potential overbought conditions, MACD to confirm trend direction, and Bollinger Bands to gauge price volatility. This multi-layered approach reduces the likelihood of false signals and enhances the probability of entering a trade at an optimal moment.
It is equally important to consider timeframes when using technical indicators. Short-term traders may focus on hourly or daily charts to capture immediate price movements, while longer-term investors might examine weekly or monthly charts to identify broader trends. Aligning indicators with the chosen trading horizon ensures that strategies are appropriately scaled to the market’s rhythm.
Leveraging Resources to Build Trading Skills
For traders looking to refine their technical analysis skills, education and practice are invaluable. Numerous platforms provide tools, tutorials, and real-time market data to support learning and decision-making. Engaging with reputable brokers and investment platforms can also provide access to advanced charting software and analytics that streamline the application of technical indicators.
For those eager to start their journey or enhance their trading strategies, it is essential to engage with reliable sources and cultivate a disciplined approach. Traders can develop both theoretical knowledge and practical skills, learning how to read charts, interpret indicators, and implement strategies effectively. Resources like expert-led webinars, tutorials, and simulation accounts allow for risk-free practice and confidence-building before deploying real capital. One such resource is Learn to invest with ADSS, which offers structured guidance for understanding technical analysis and applying it to real-world commodity markets.
Conclusion: Timing as a Competitive Edge
In commodity trading, timing is often the differentiator between profit and loss. Technical analysis, particularly when enhanced by advanced indicators, equips traders with the insights needed to make informed decisions. By combining momentum, volatility, and volume indicators and integrating these tools with disciplined risk management, traders can identify strategic entry points, respond to market trends, and manage exposures effectively.
Technical analysis is not merely about predicting price movements—it is about understanding market behaviour, developing a structured approach, and cultivating the discipline required to act decisively. With the right tools, education, and practice, traders can navigate the complexities of commodity markets with confidence. By leveraging resources and learning from experienced platforms, traders are empowered to approach investments strategically, turning market volatility into opportunity.